Debug (Java Development)
Summary
- This section describes how to debug the application which was developed in SAStruts + S2JDBC Framework.
- There are 2 methods for debugging.
- Starting from Server View
- Starting server from resin.exe, and using Java Remote Debug
Starting from Server View
- If the module project to be debugged has not been associated with debug server, following steps will be taken.
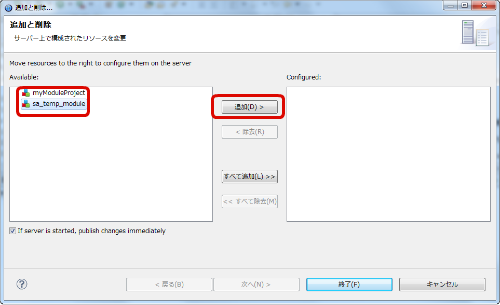
Right click the Debug Server from Server View, and select [Add and Delete].

On the [Add and Delete] wizard, add the target Module Project, and press the [Finish] button.
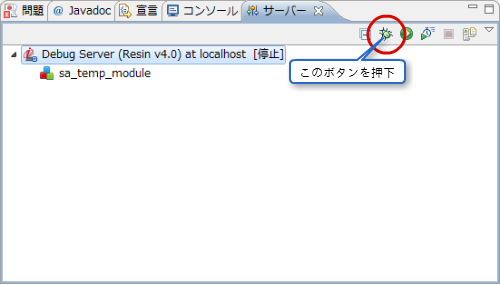
Module Project is added to the Debug Server. Start the debug of Debug Server.
Column
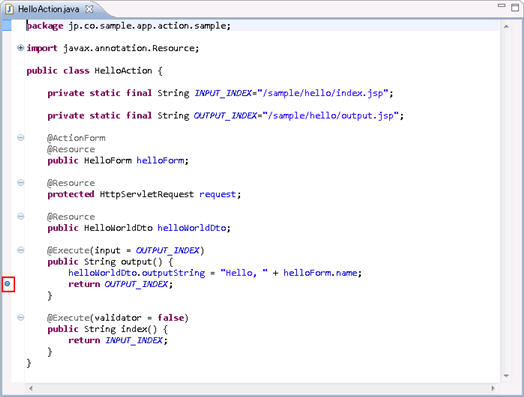
Please refer to [Resin Setting for Development Environment] of e Builder Setup Guide for how to set debug server for Server View.Open the Java file in the project to be debugged, and set the break point.
Execute the process of the debug target on the browser.
Debug mode of eclipse is started.
Starting Server from resin.exe, and using Java Remote Debug
Start the Resin server.
From the eclipse tool bar, select [Run] → [Debug Configuration].
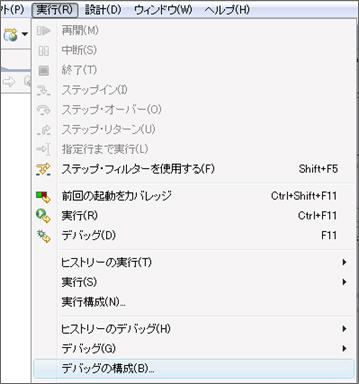
From the Menu, select [New] from [Remote Java Application], and create the new startup configuration.
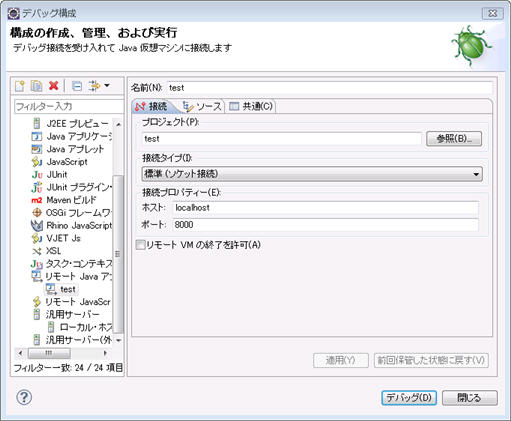
Set the following on the Connection tab.
- Enter the label of startup configuration in the Name field (optional).
- Select the project to be debugged in the Source.
- Set [Standard (Socket Connection)] as connection type.
- Put the host name at server startup to the host name and the port number specified in jvm_args to the port number of Connection Property.
Select the project to be debugged on the Source tab, and add it.
Apply the debug configuration, and run it.
Open the Java file in the project to be debugged, and set the break points.
Run the process of debug target on the browser.
eclipse debug mode is started.